Observatory ONL
Digital Transformation
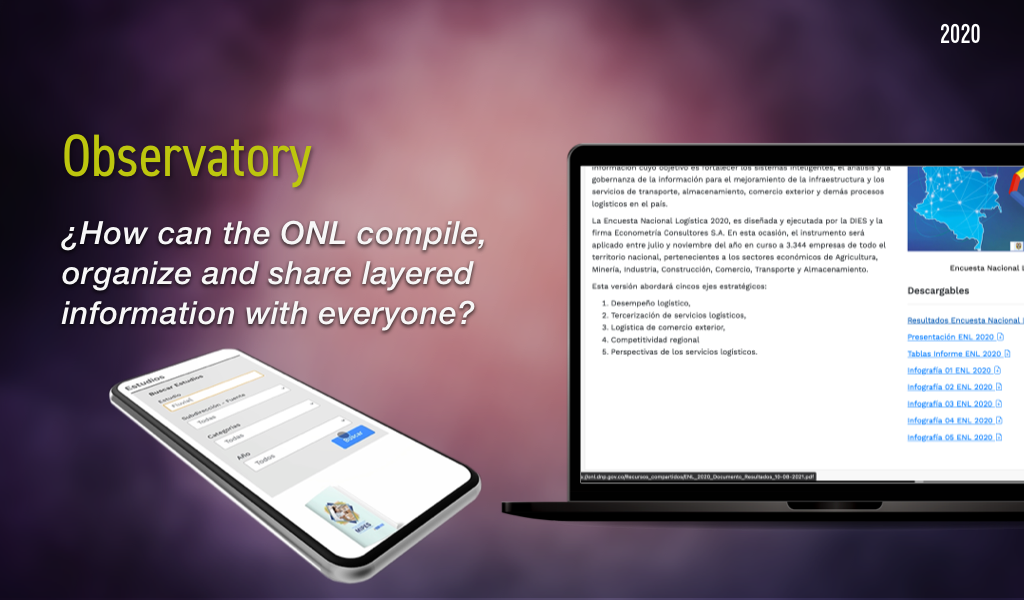
The National Observatory for Logistics, ONL, is a B2B web portal and app built to highlight key indicators from several government's departments and agencies.
It's main goal is to formulate new conclusions from unprocessed strategic information and share it with other agencies.
-
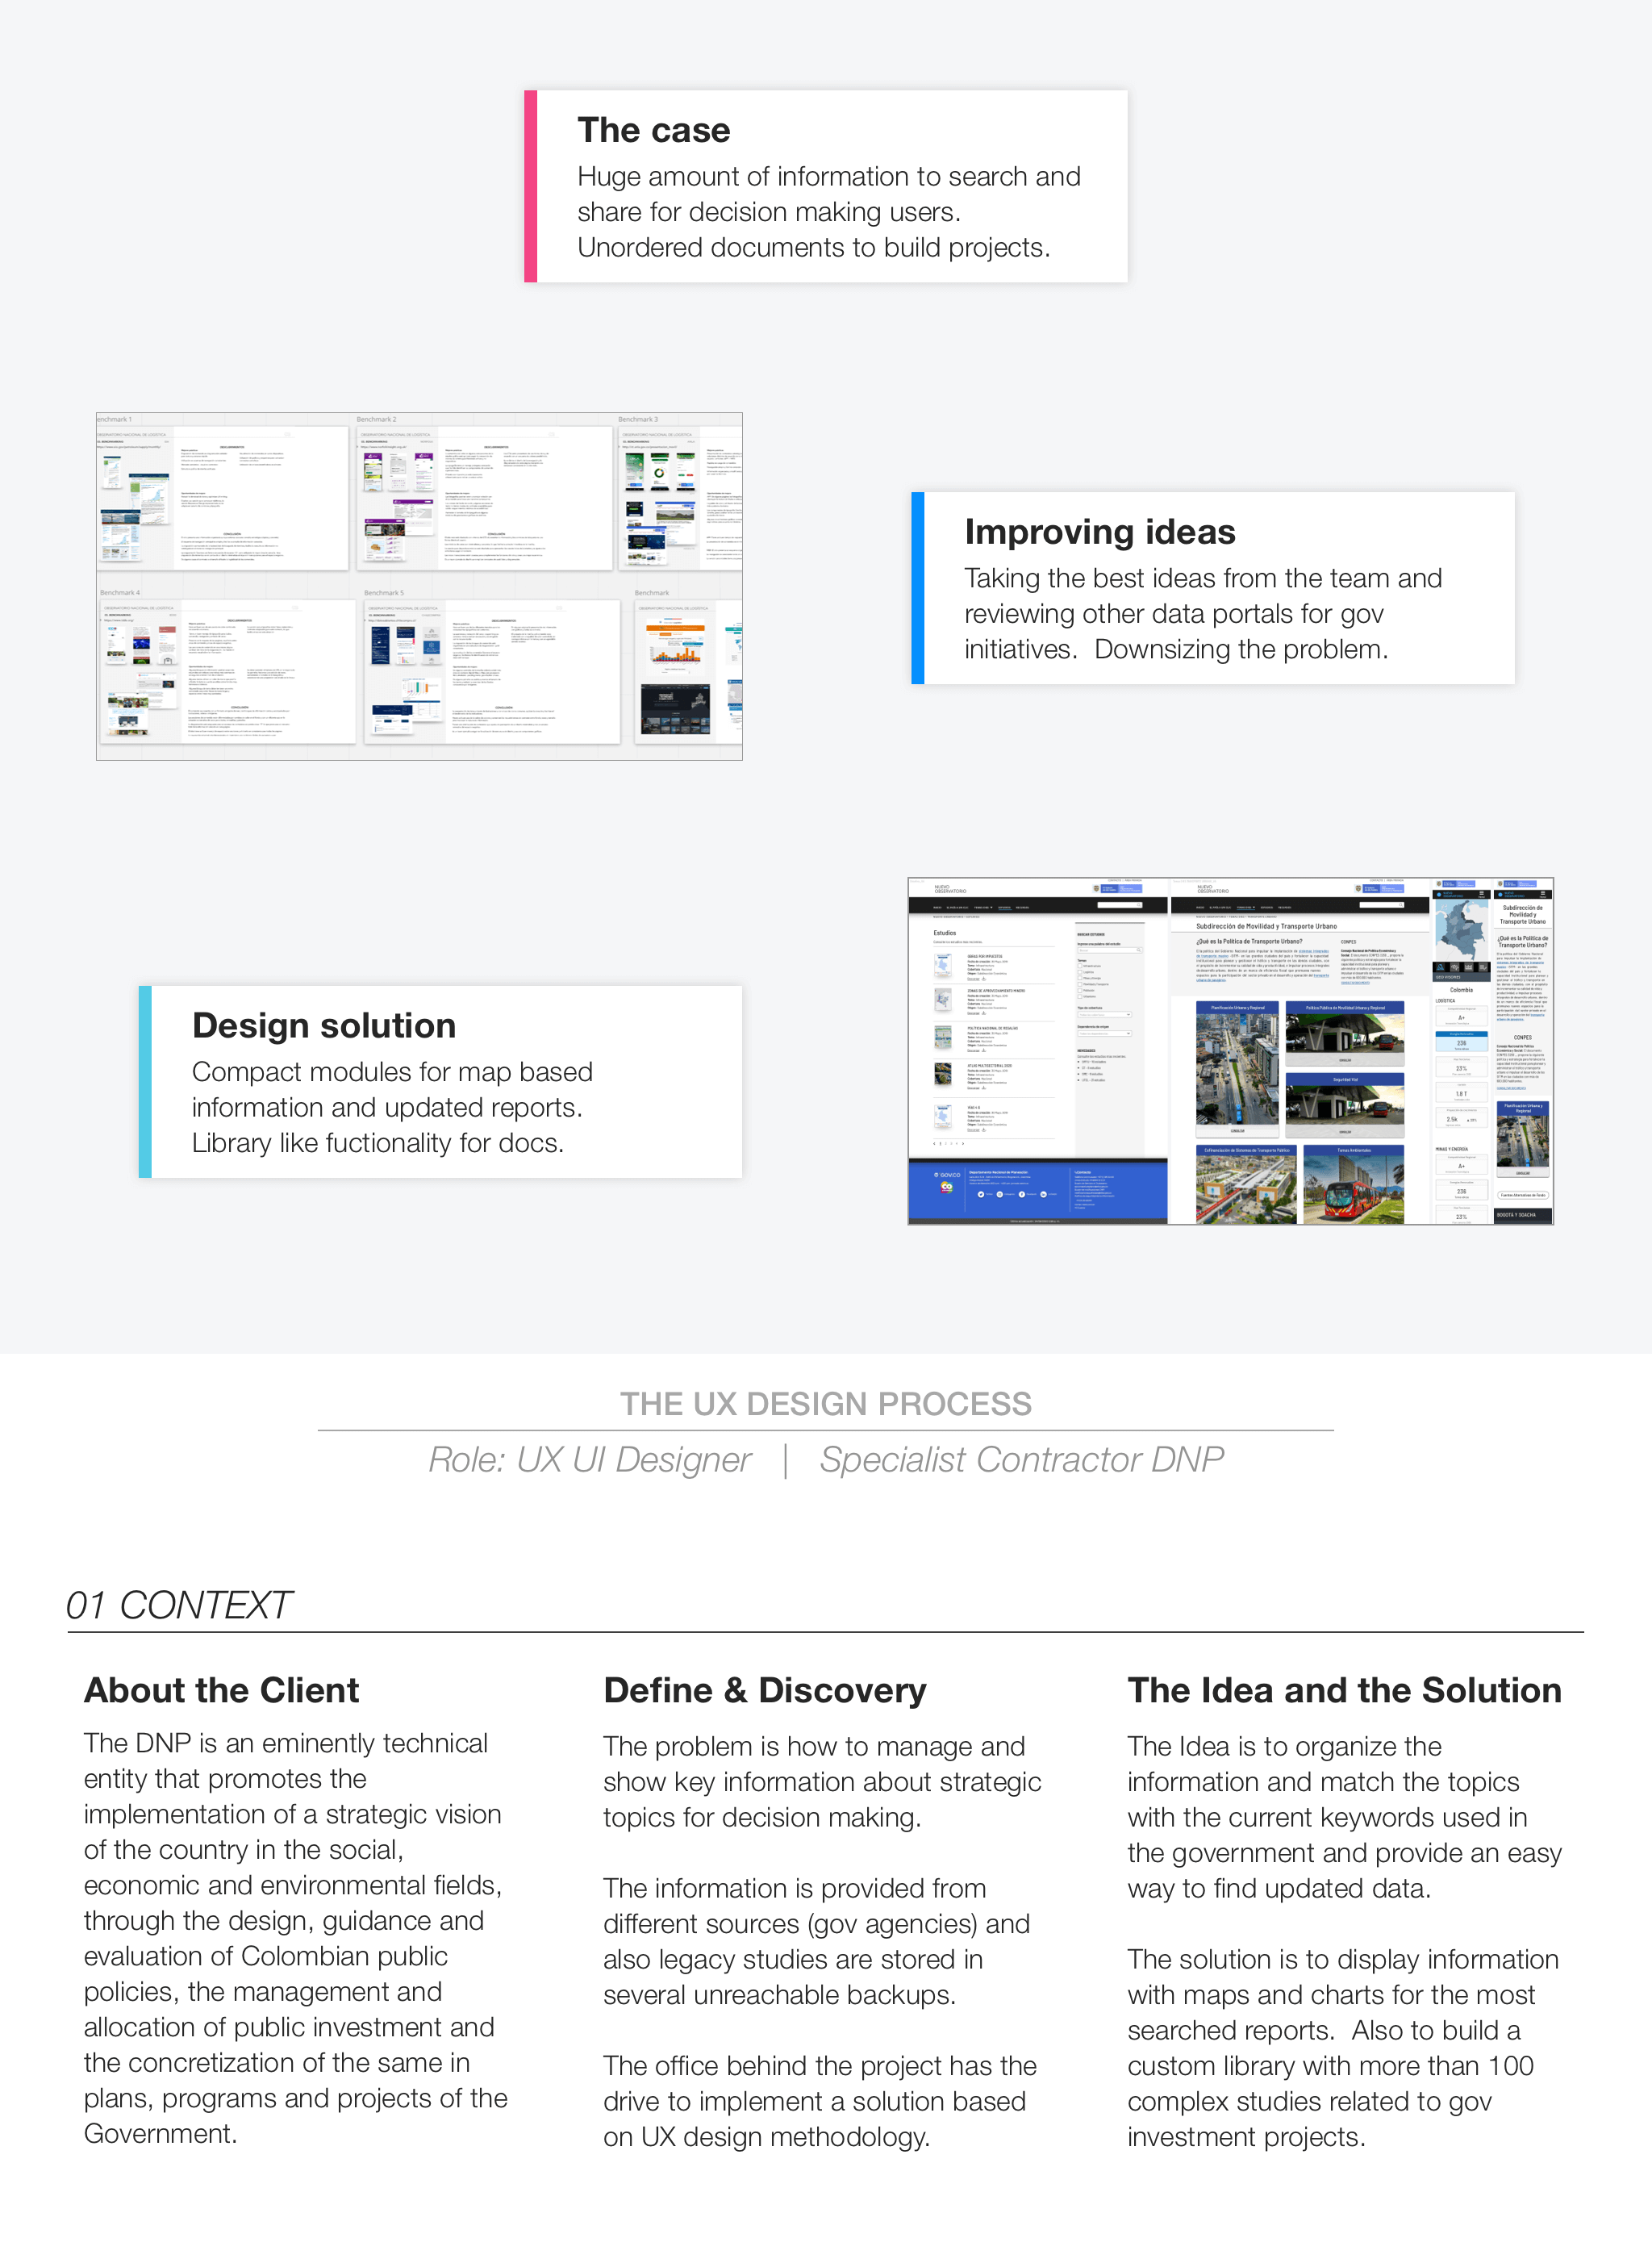
01 CONTEXT
-
02 RESEARCH
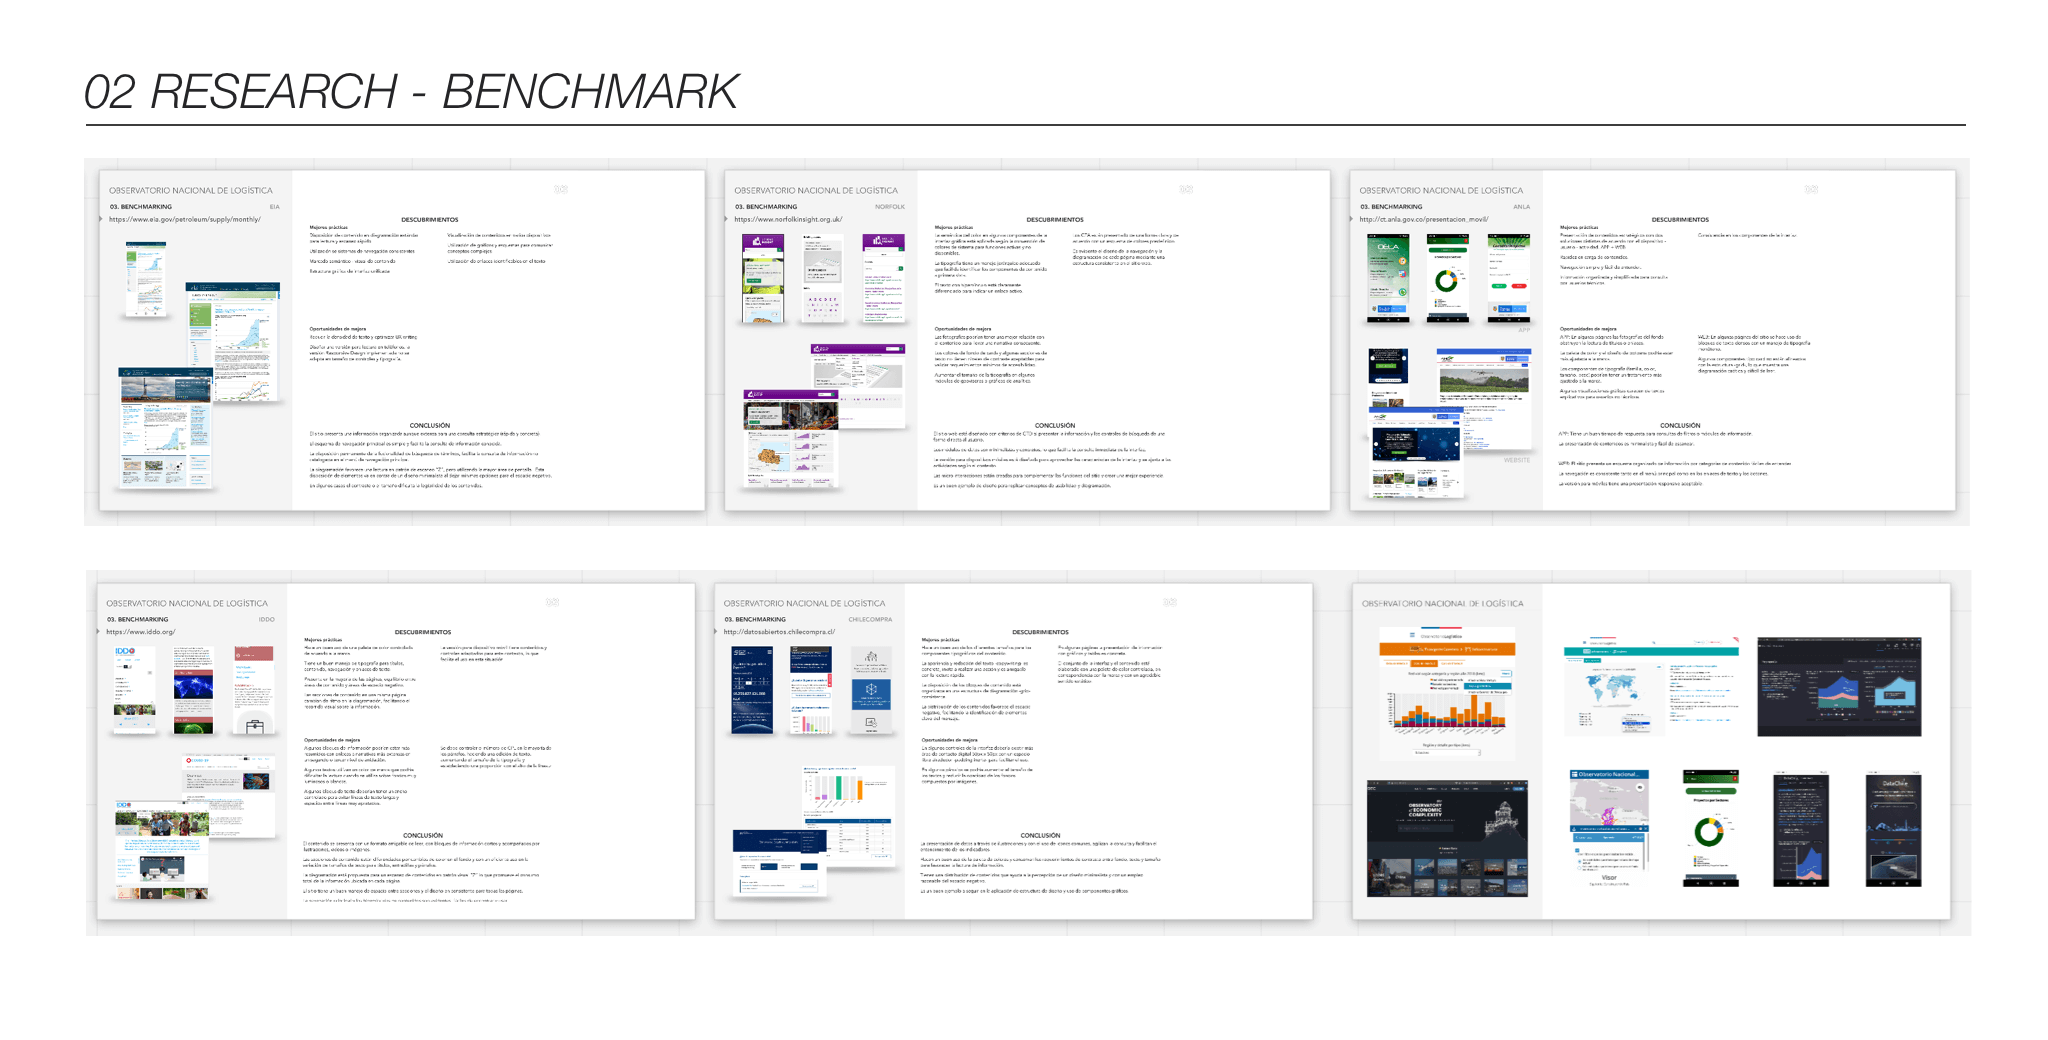
The first step I took was to apply a fast Benchmark for 10 related sites and apps, that were a reference for their project.
There were sites to review content architecture, functionalities, data viz trends and tools.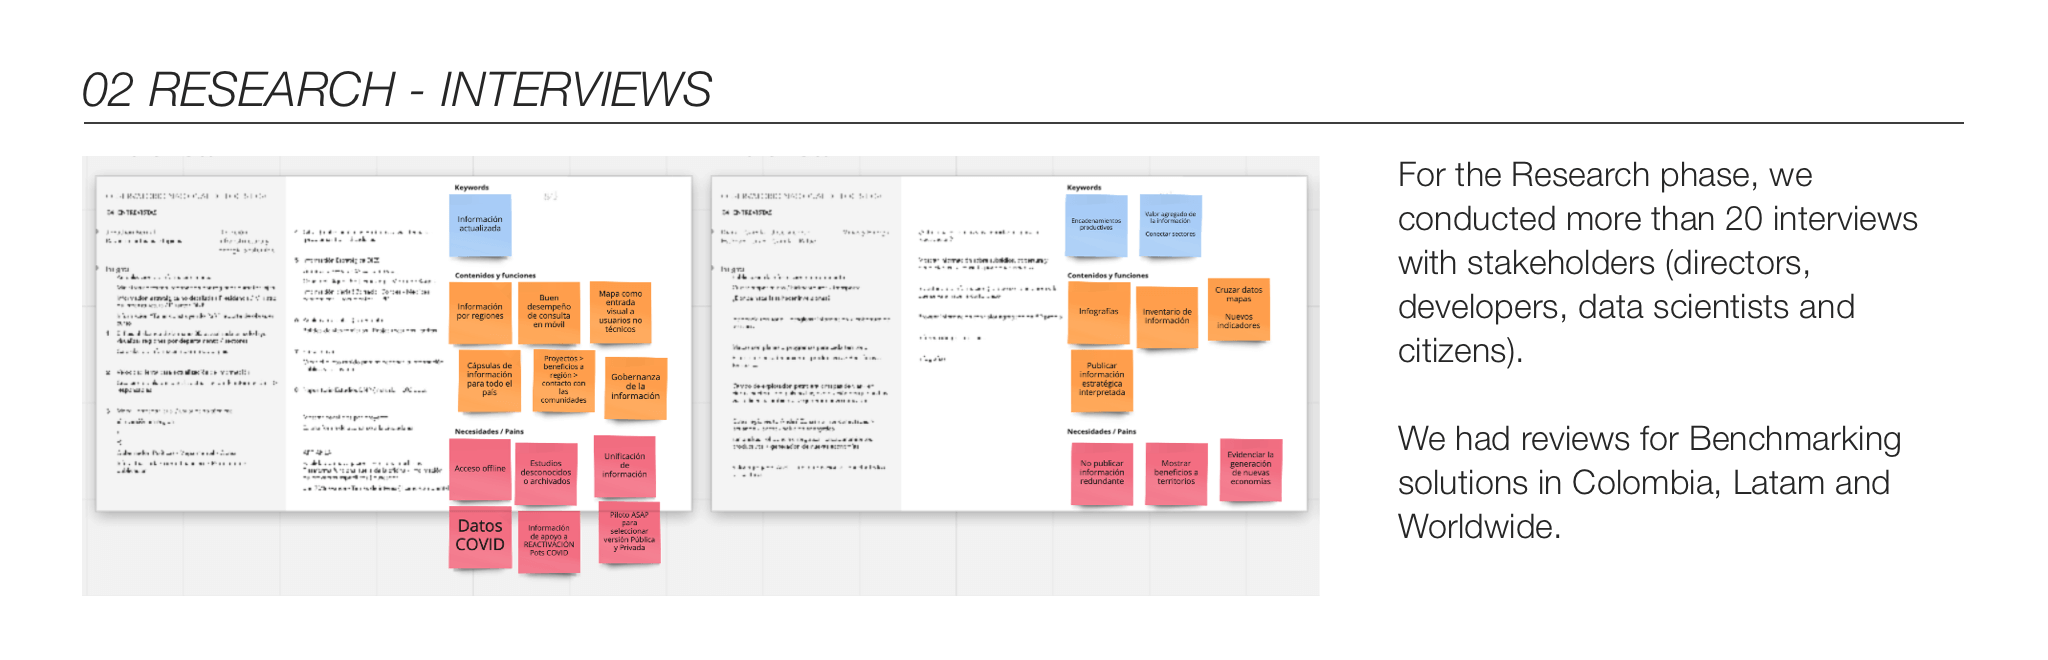
In order to find out the client's expectations, I applied a set of focus group interviews to define:
- Visual output for KPI information
- Technical restrictions for maps
- State of art for current documents / studies
I found that every team had different approach to obtain and deliver their information based on their distinctive topic.
As a team we had to agree to set a common vocabulary to build categories and navigation modules. -
03 USER NEEDS
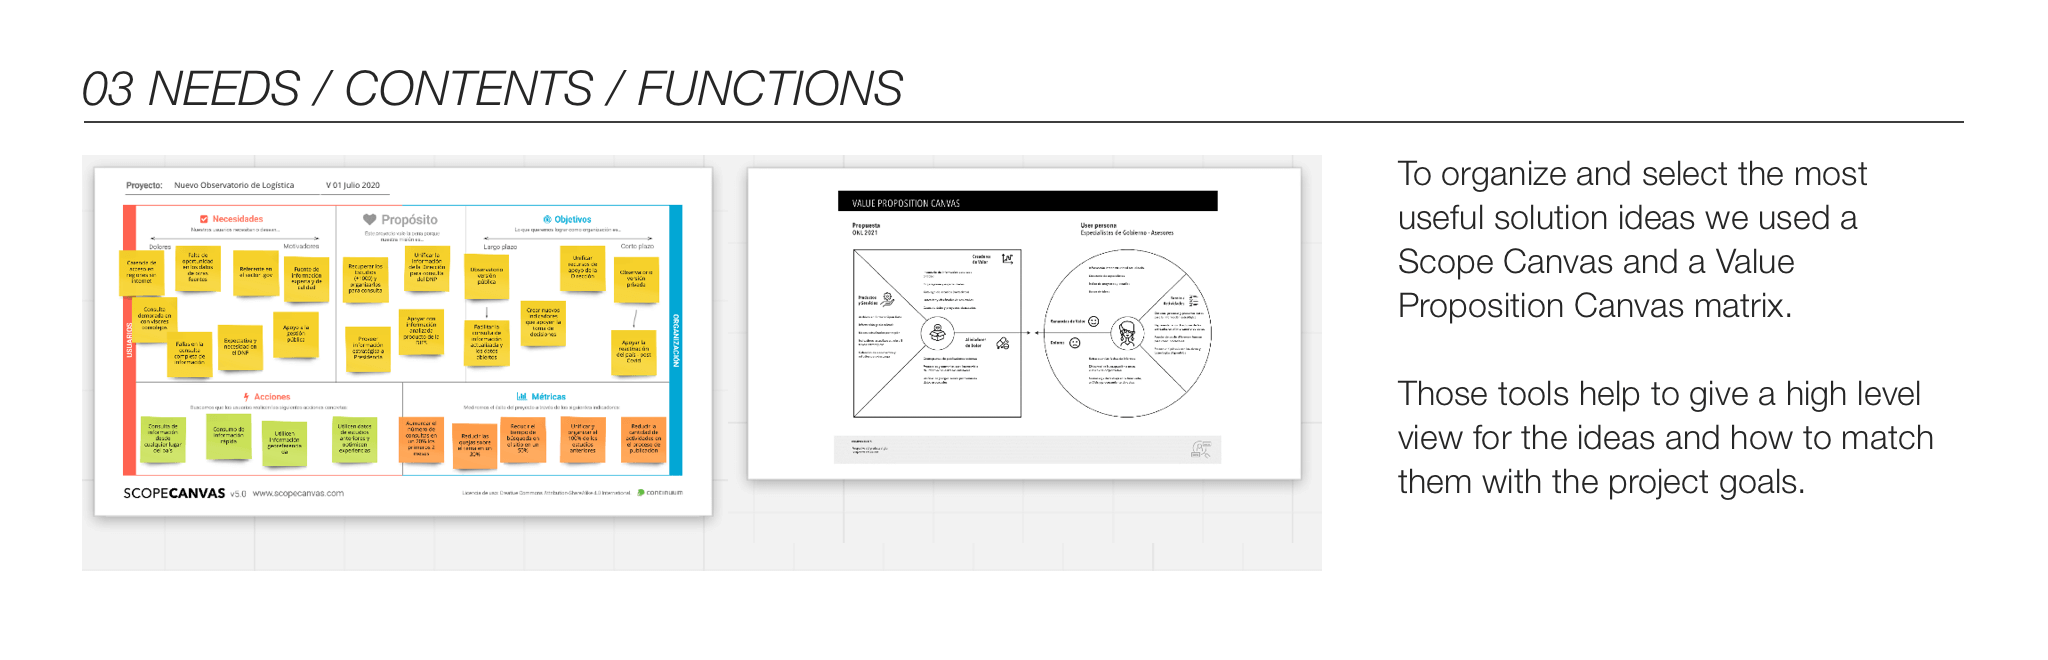
I grouped the insights and conclusions using a set of Canvas tools.
With a few sessions we discovered that the project had at least 3 phases to keep in mind for future releases.
That input gave the team a set of activities to prioritize for the first release.Needs:Display a set of KPI modules and import a group of layered maps to showcase dynamic information.
Publish a collection of unindexed documents related to different logistic's topics.
Highlight new projects.Content: Collect and curate the copy for each section in the Observatory.
That lead us to think in sub site structure to keep in mind the scaling requirement.Functions: Customized library for the documents, ezine or news section, writing editing for a common understanding.
-
04 CONTENT PLANNING
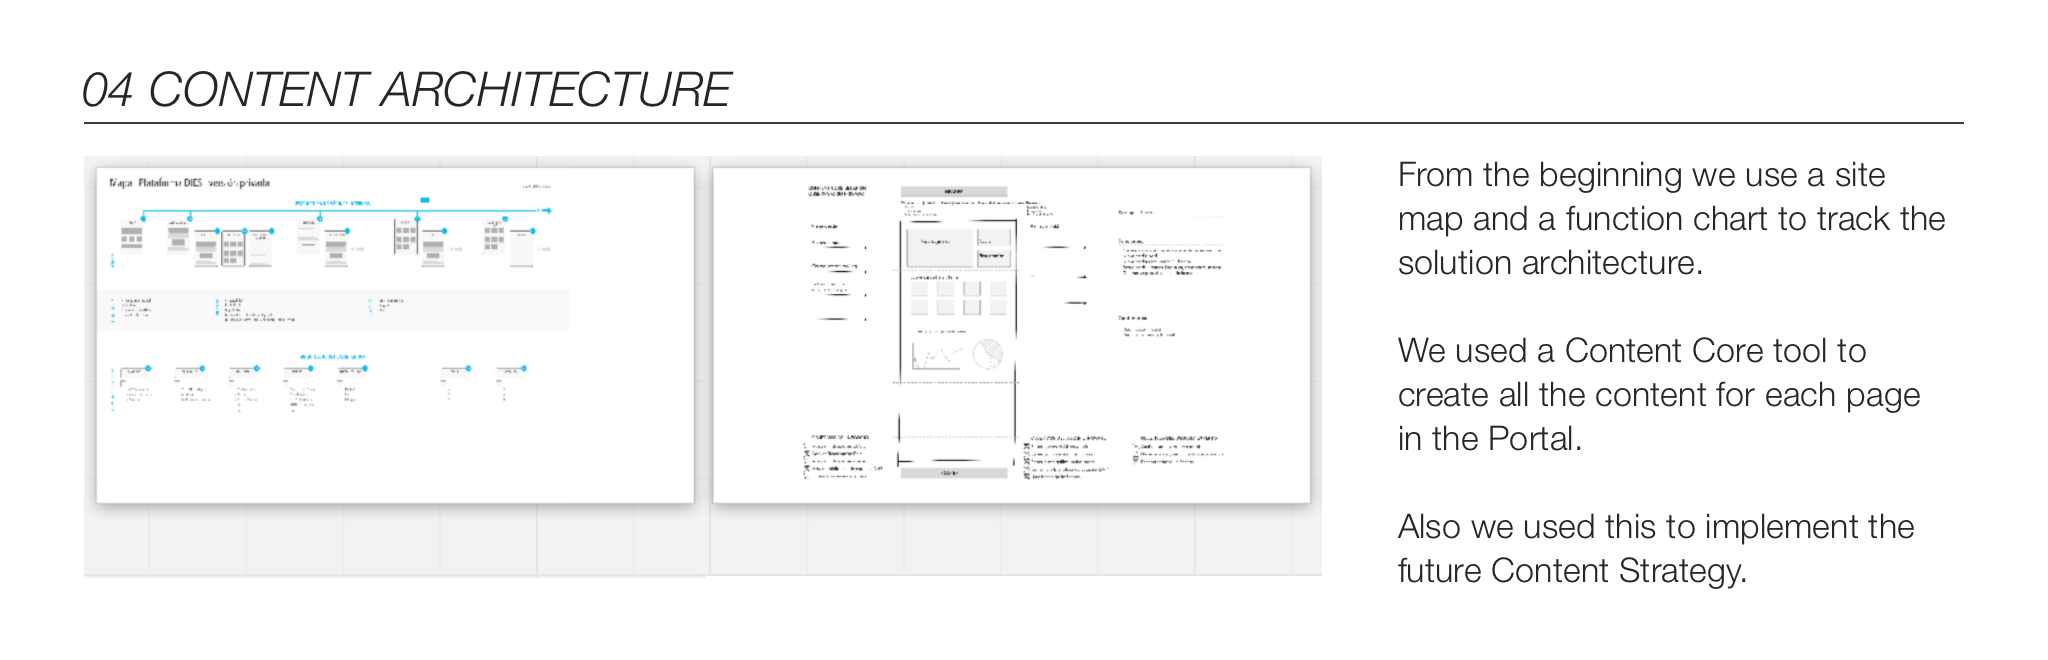
I drew a series of alternatives for organizing the content map.
We chose a basic structure that allowed us to add new content related to the general categories of the Observatory.Then I used the Content Core Canvas to help each team to imagine the information / user flow.
- Main content
- Come from - go to
- Support content
- New ideas for next release...
-
05 WIREFRAMES
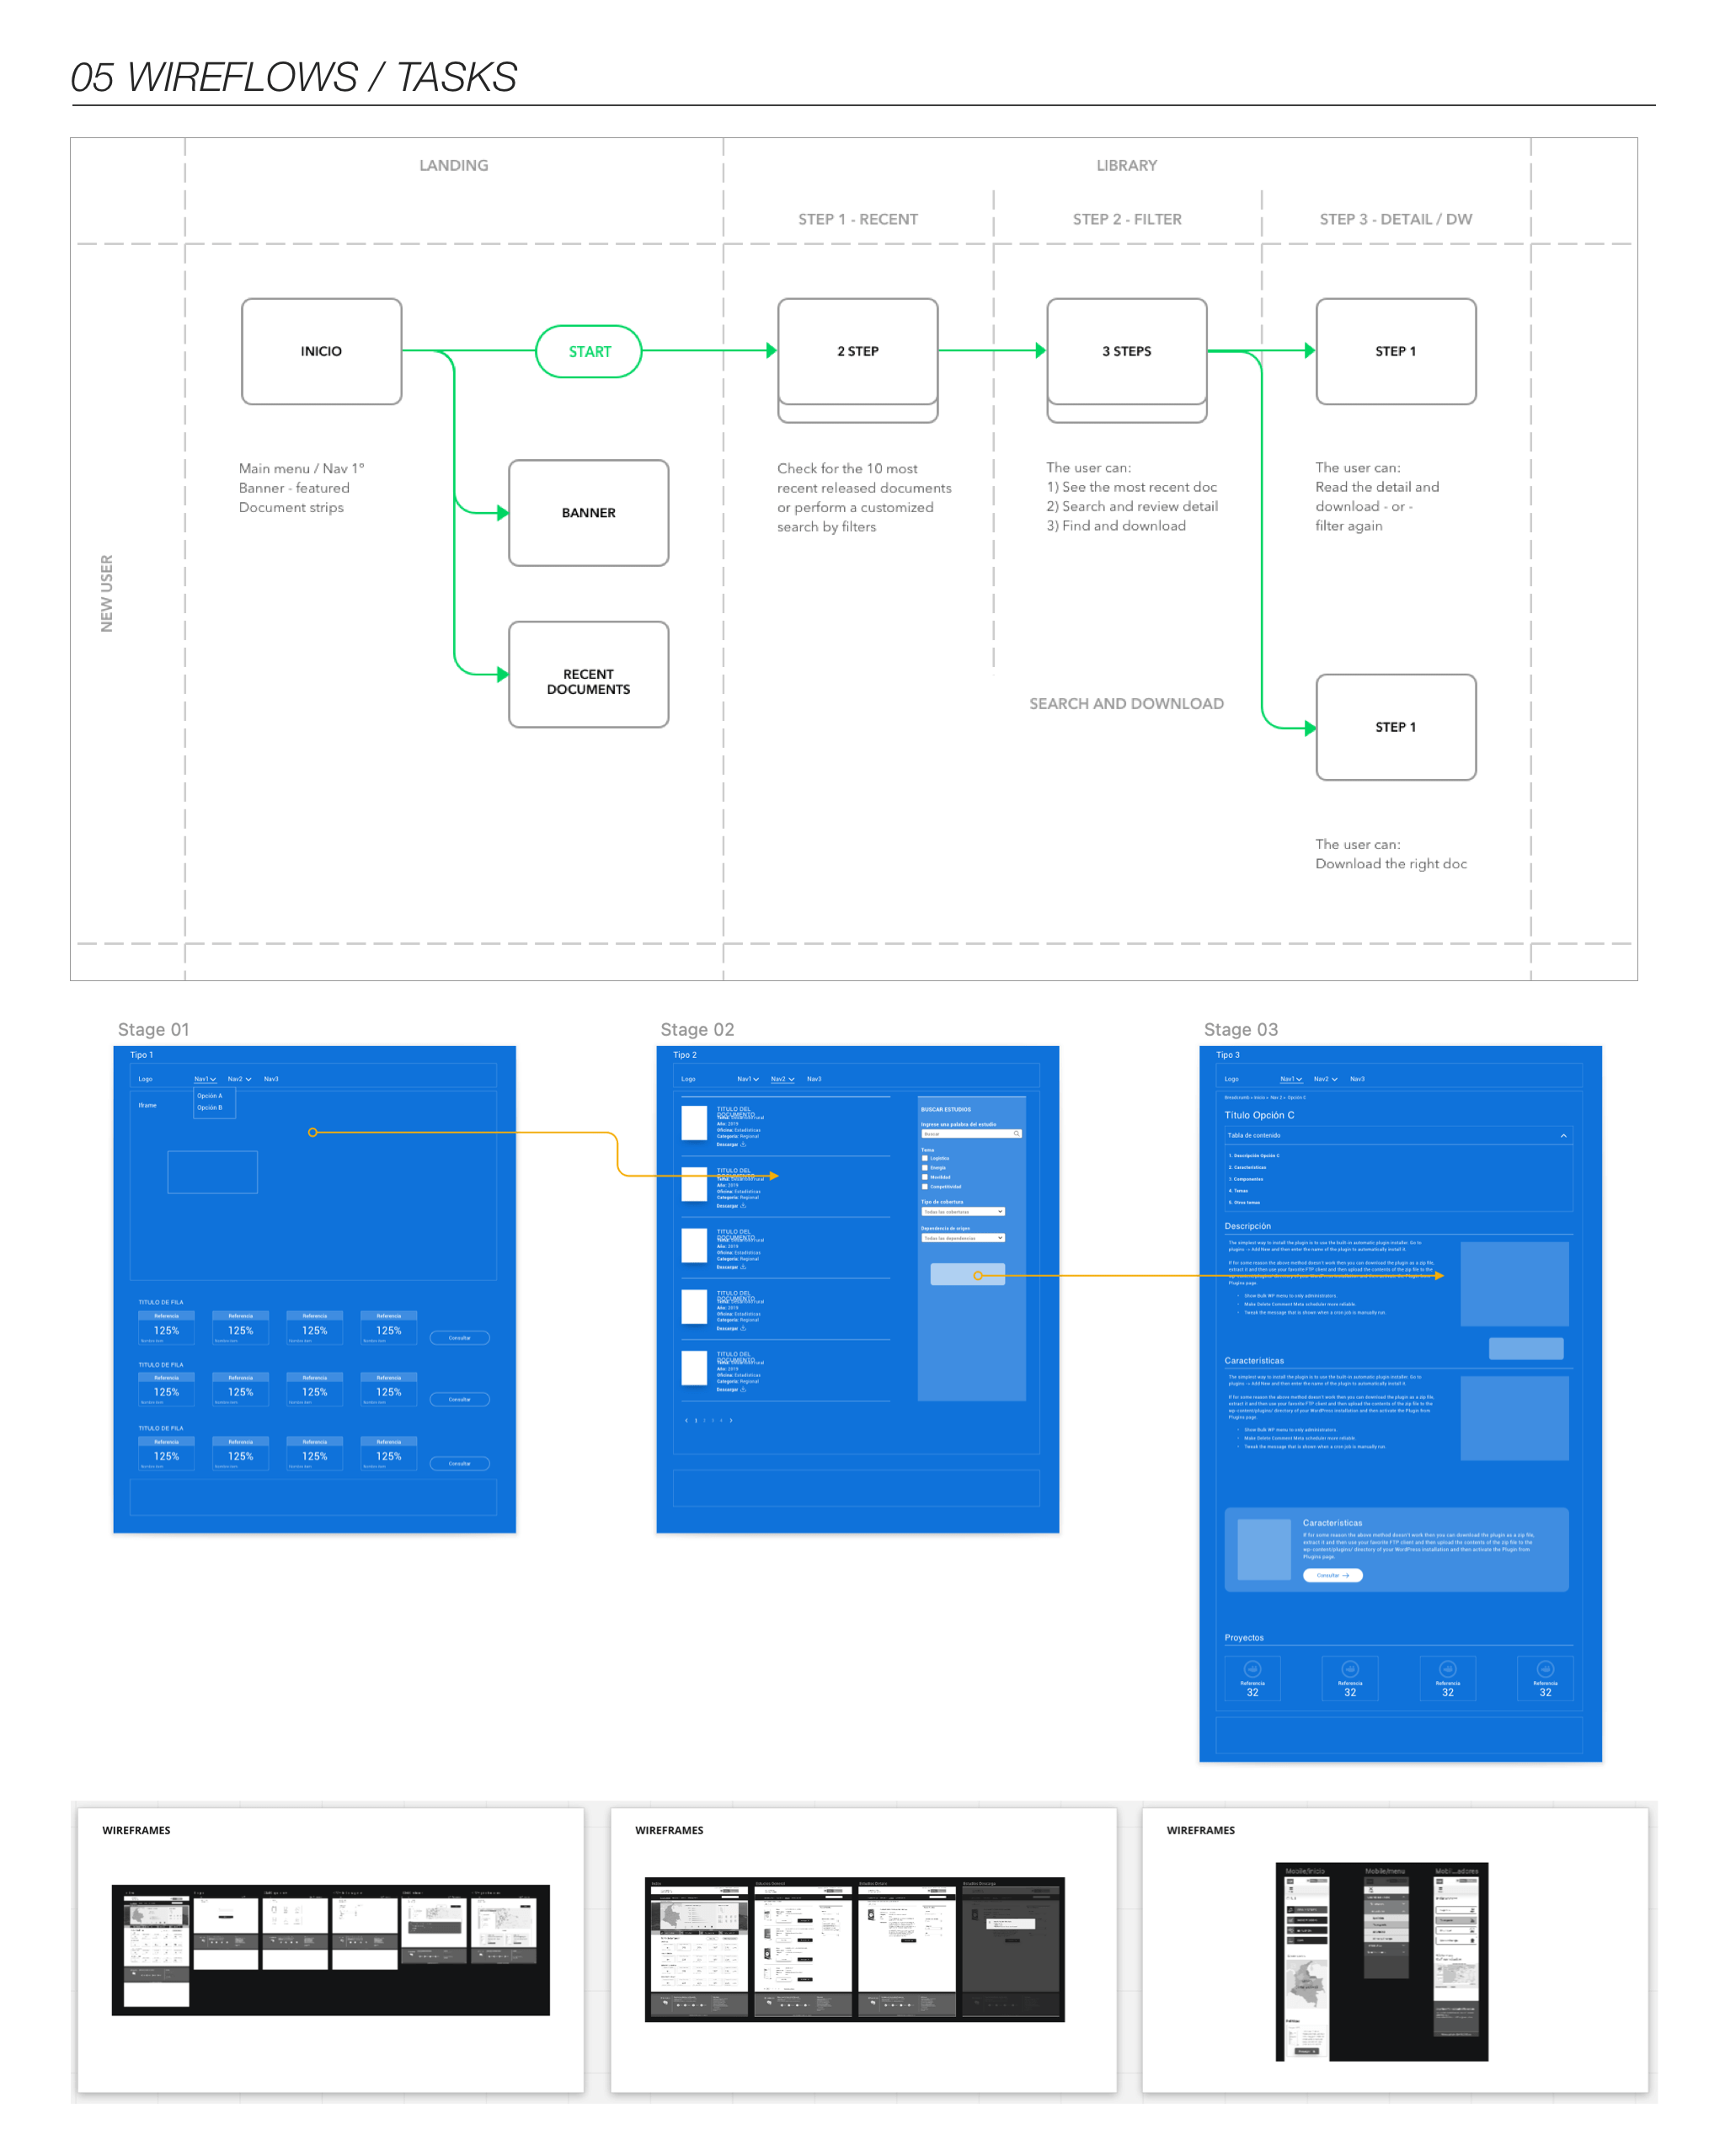
I prepared a set of interactive tests for the main wireflows:
- Document search and download
- KPI search
- Office's main content
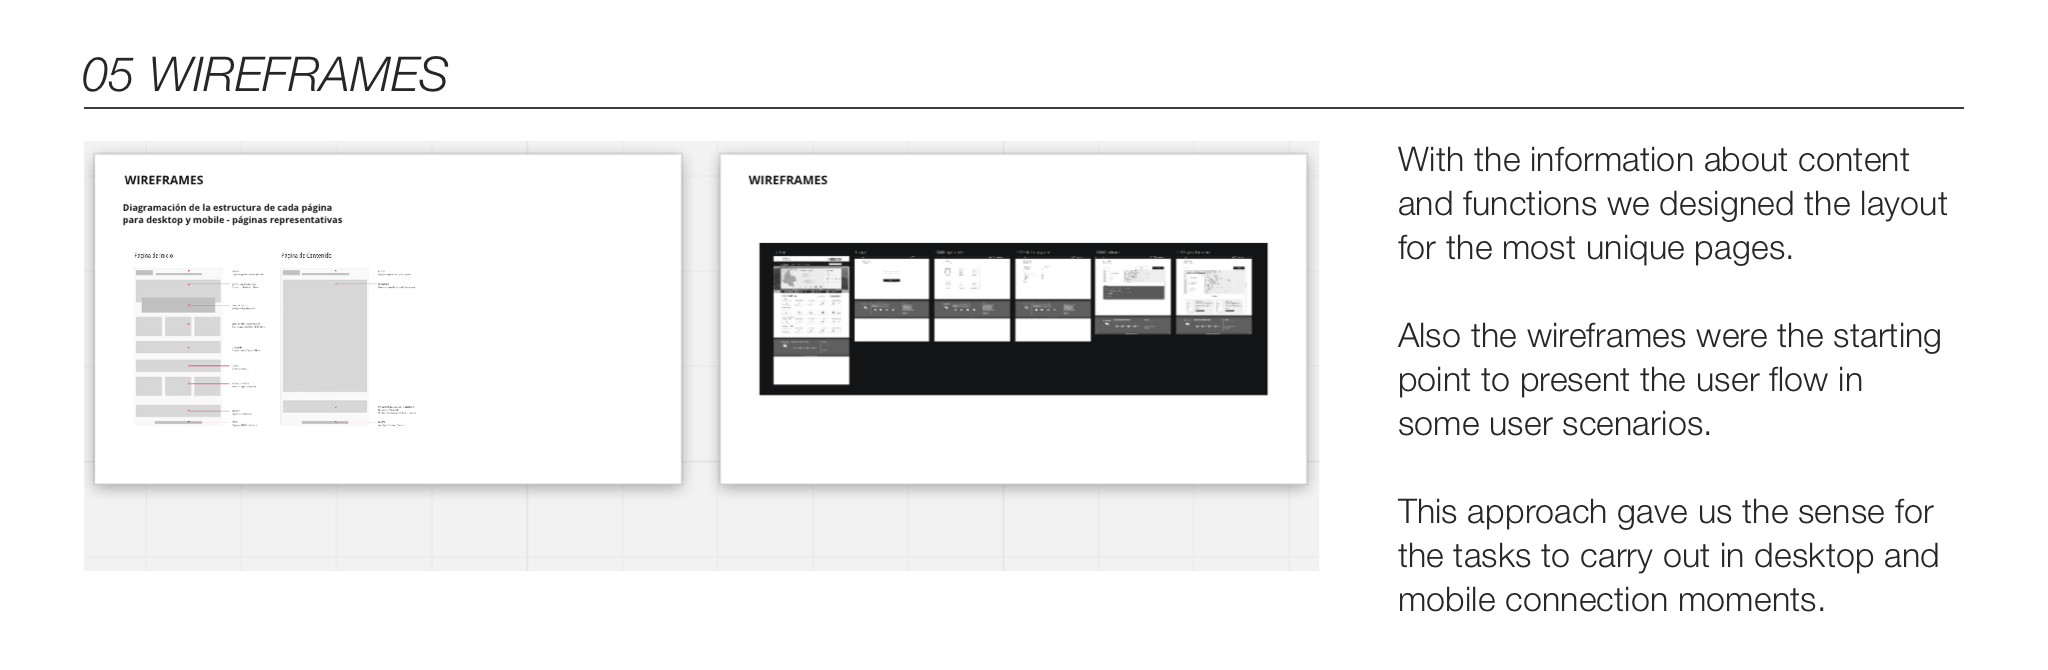
Every iteration and meeting gave me enough ideas to refine the wireframes and anticipate some mobile screen interactions.
-
06 PROTOTYPE
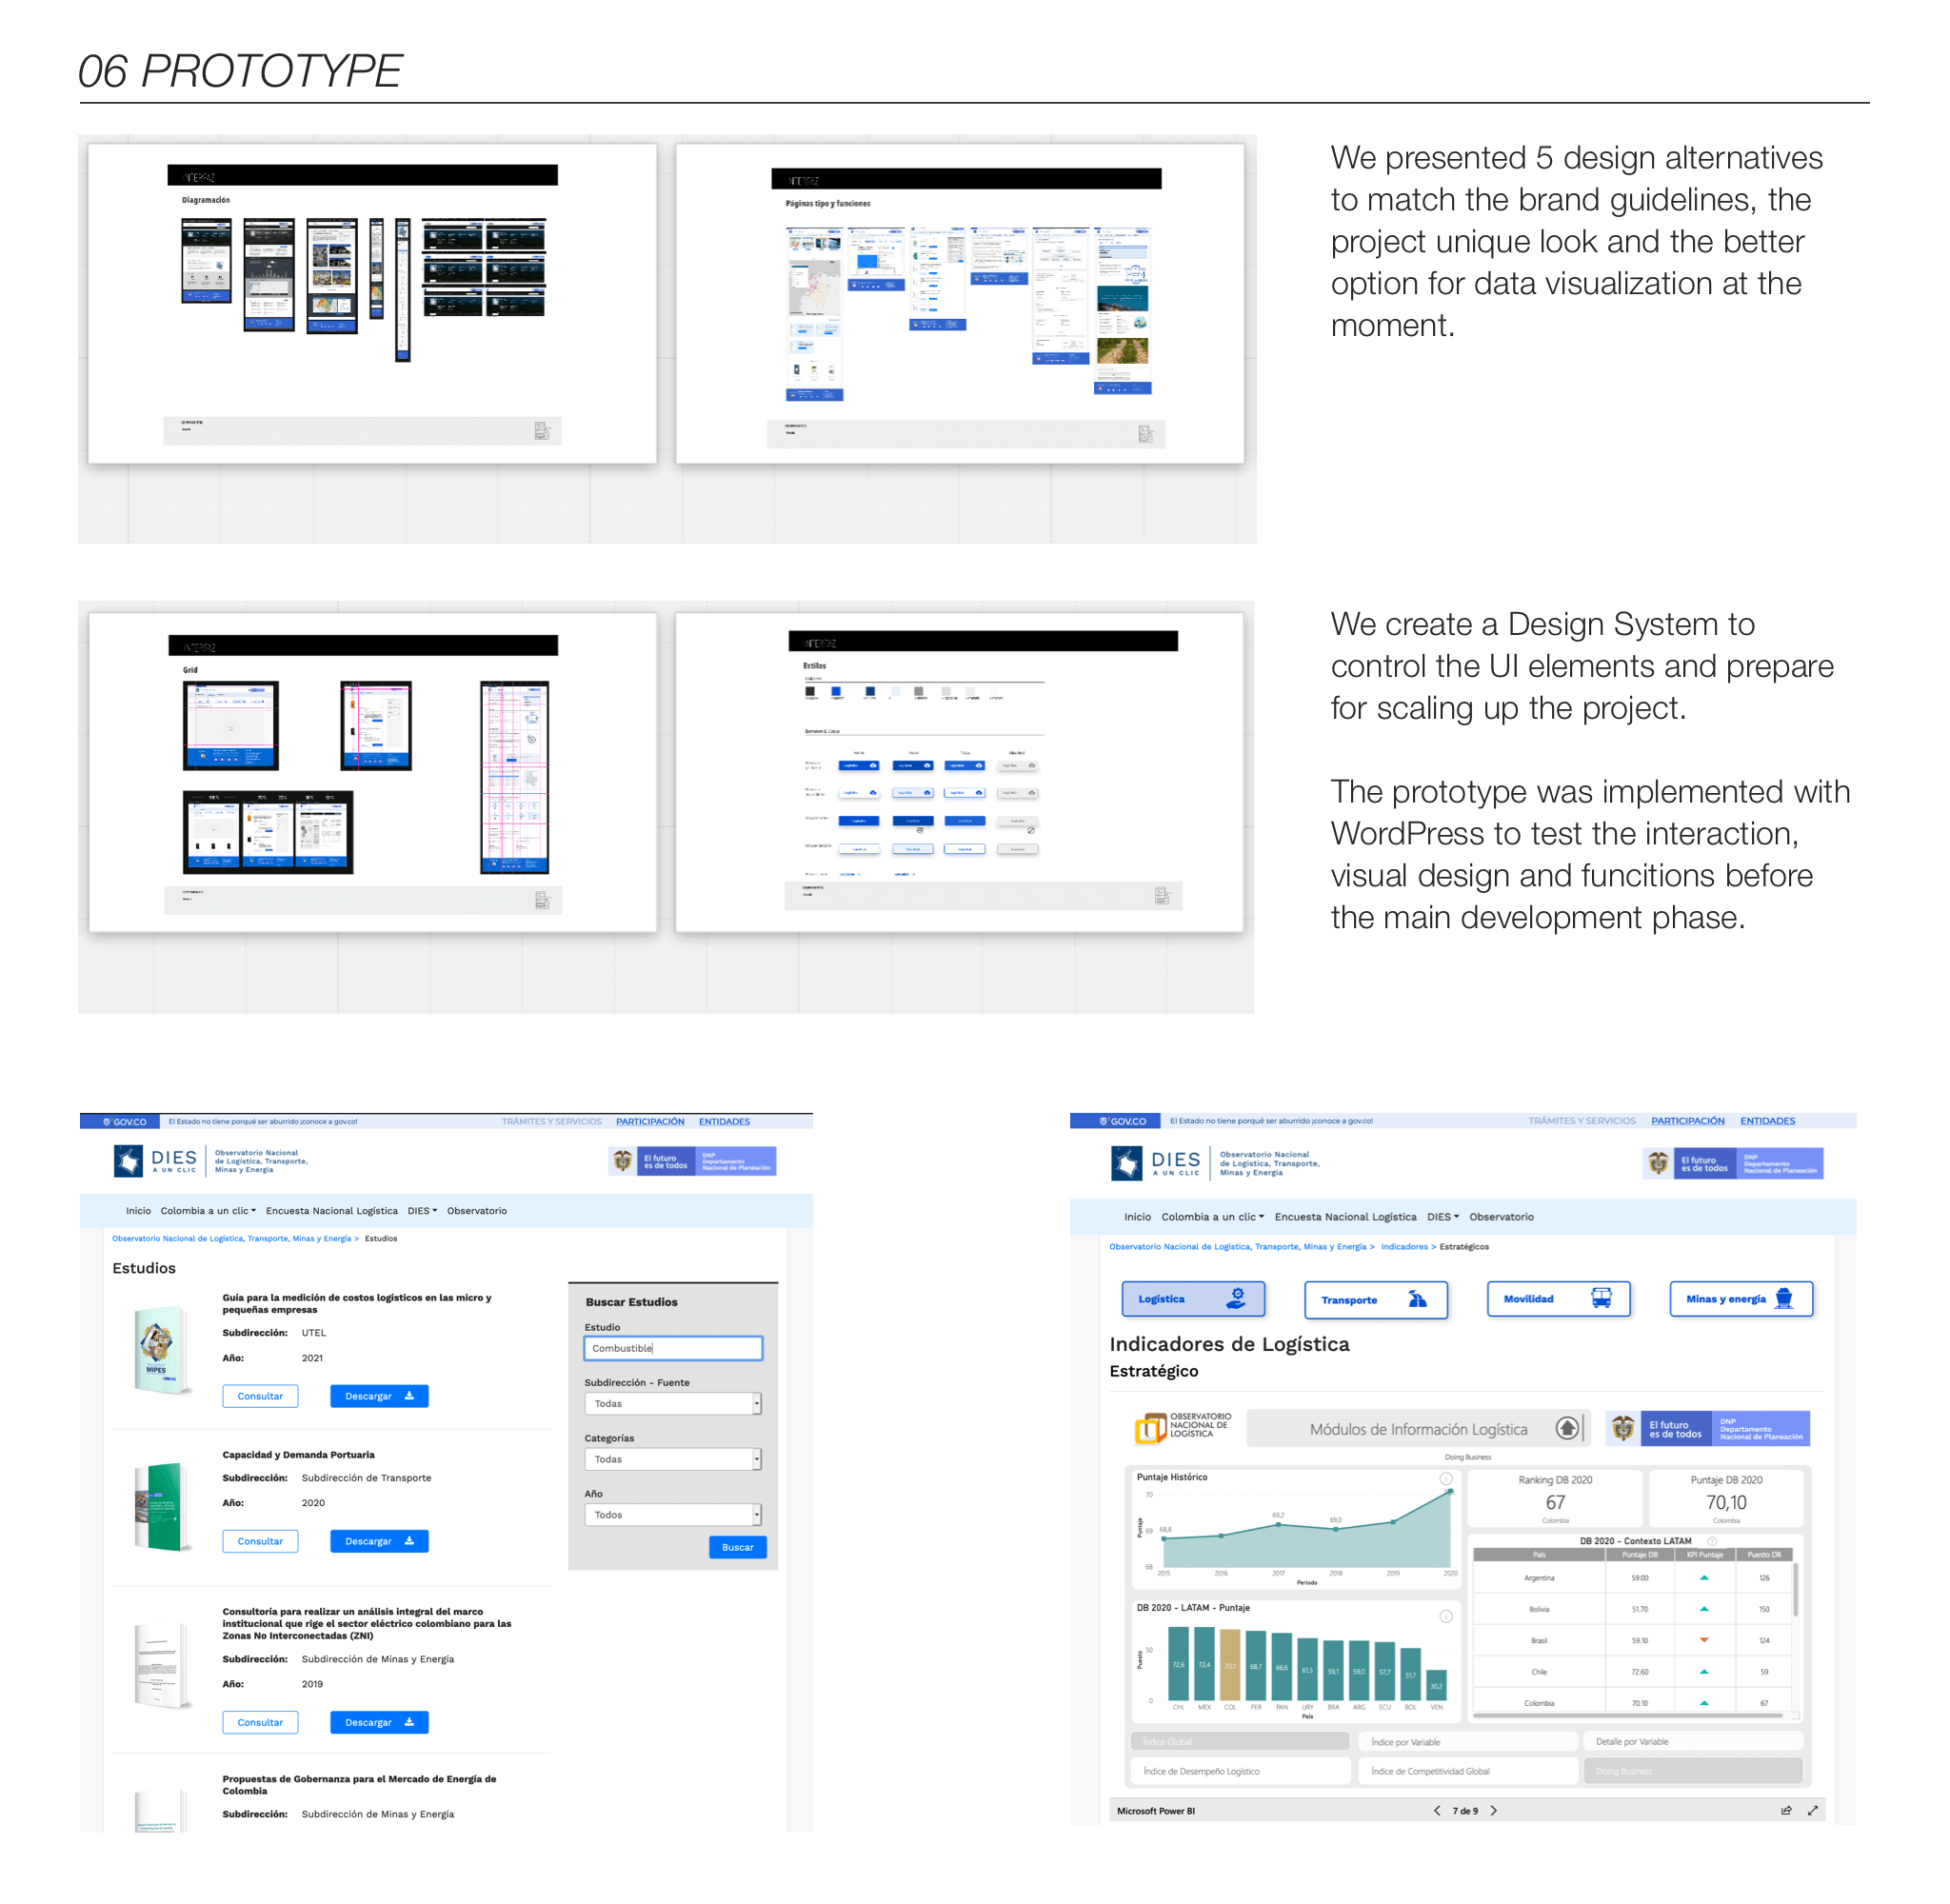
 Pre production prototype
I used WordPress to build a test site to show all the interaction.
That approach gave to the team the precise functional scope and UI guidelines usage to develop the final web portal.
Learnings
Every project give me the chance to learn more about applied internet solutions.
Project management: I was the design leader for that project, and I successfully used design methodologies to organize and implement the website.
Design skills: I found new ways to show design ideas, Miro App was a great support to keep track of all the design process.
Time management: I could convince the team to give enough time to research and design to reduce future failures and wasting time tasks.
Outcomes
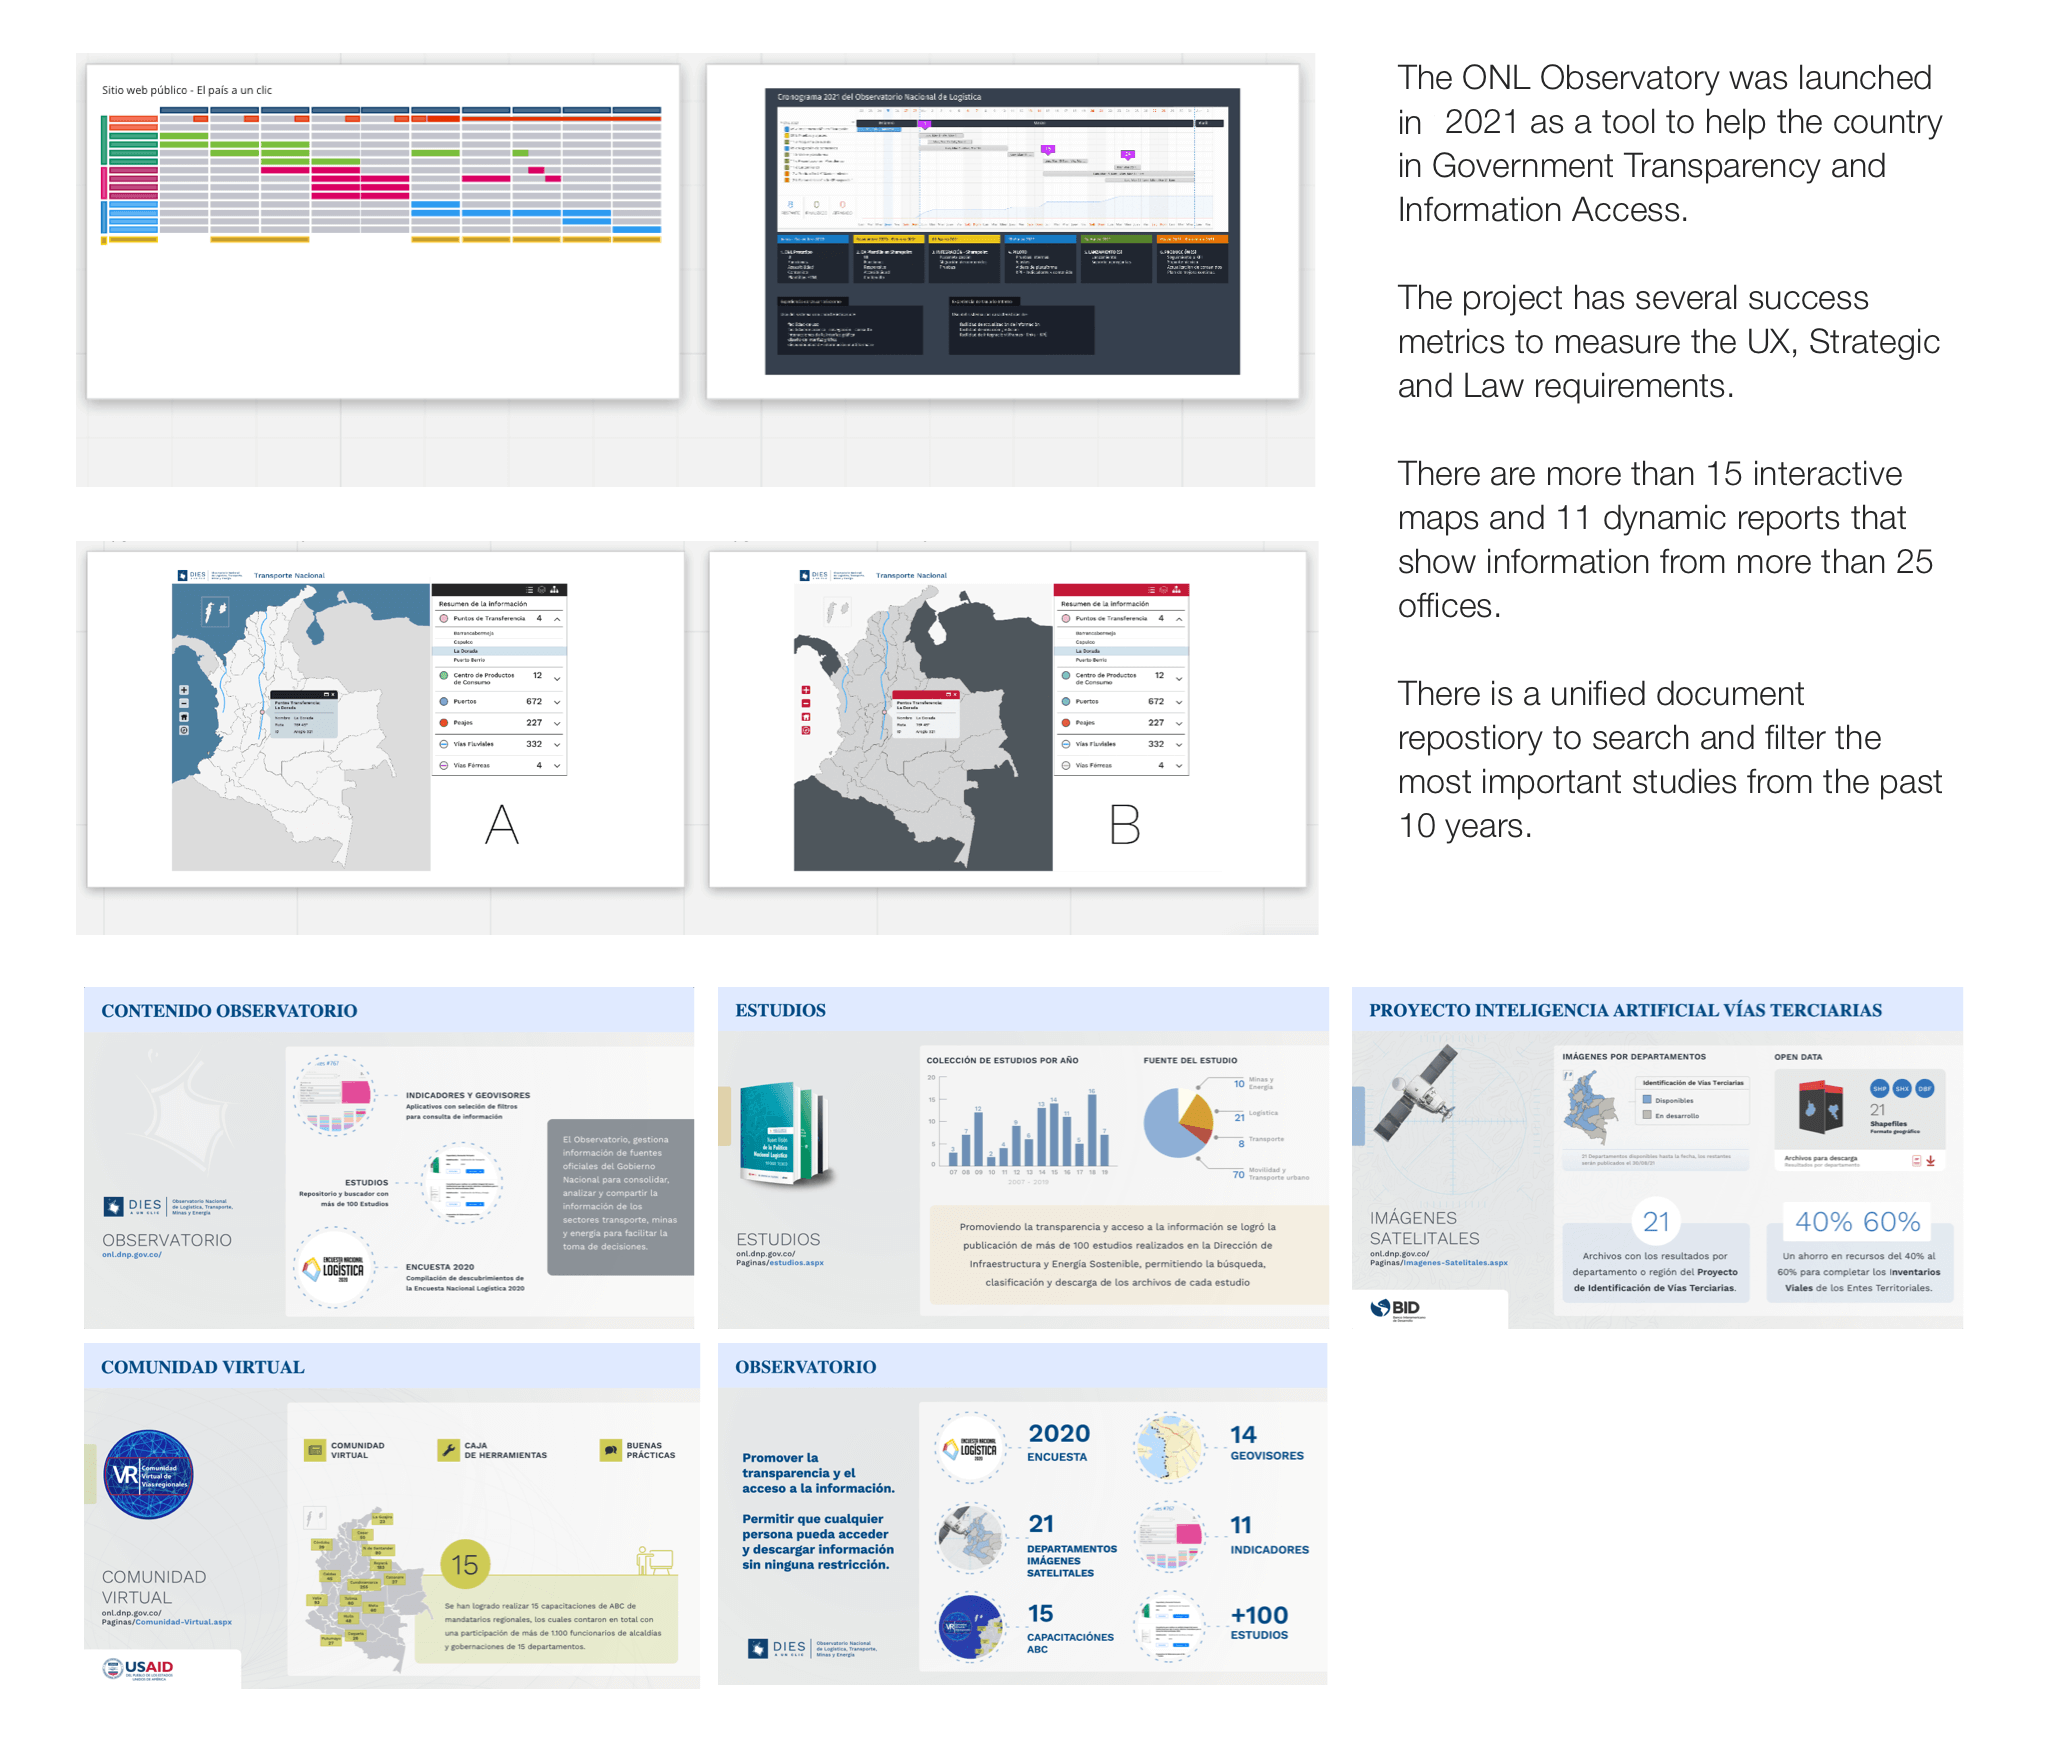
- Showcase and index more than 100 studies / documents.
- Displayed more than 30 KPI dashboards and maps.
- Connected the ONL with 32 states and more than 8 countries.
- We influenced the savings of more than USD $10 million by publishing open data about third-level hidden pathways.